Historical Comparison: Prison Policy In England and Wales Before and After 1993
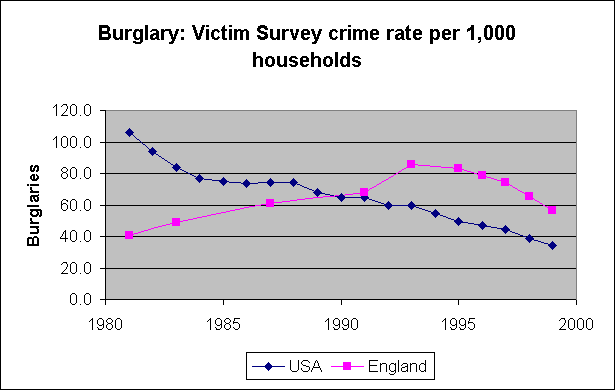
The graphs draw on data from Langan and Farrington’s original 1998 study until 1995. (Click here for our discussion of the findings.) In addition, we have updated the survey crime rates for three crimes subject to British Government targets: robbery, burglary and motor vehicle theft. We are very grateful to Patrick Langan and David Farrington for supplying updated figures that permit comparison with their earlier study. The data for England and Wales are from the chapter ‘England and Wales’ in Cross-National Studies in Crime and Justice by David. P. Farrington and Darrick Jolliffe (to be published by the US Bureau of Justice Statistics).
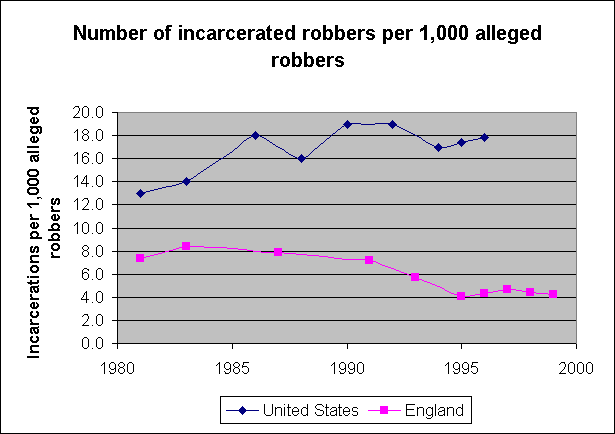
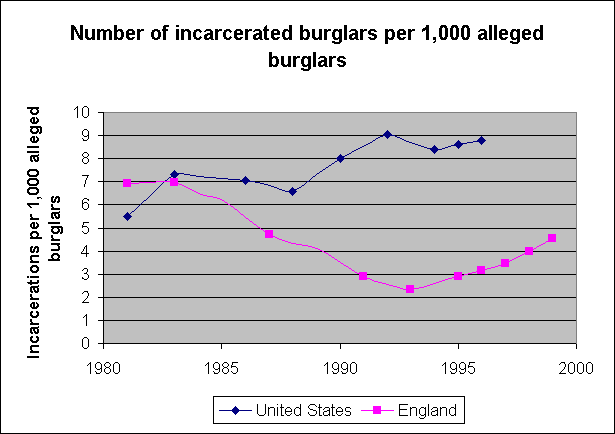
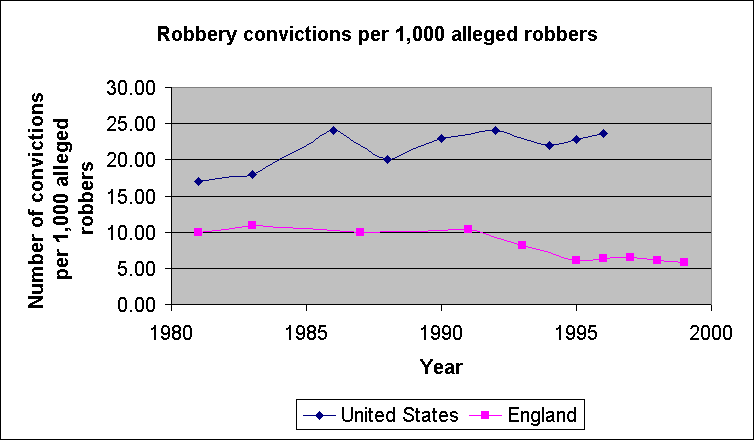
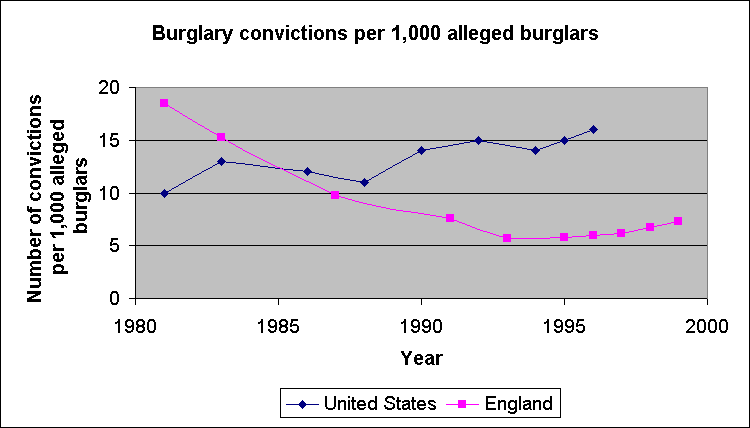
The charts below update the crime survey trends and the imprisonment rate per 1,000 alleged offenders for the three offences for which the British Government has set targets. In addition we have shown the conviction rate per 1,000 alleged offenders.
The Imprisonment Rate 1981-1999

The Conviction Rate 1981-1999

The Crime Rate 1981-1999


All BCS Crime 1981-2003
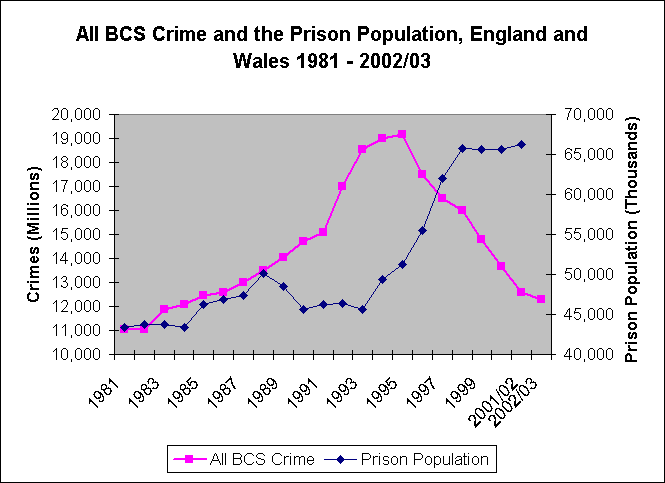
By 1993 the rising crime rate had become a major public concern and towards the end of that year the earlier anti-prison policy was reversed. Between 1993 and 1998 the average number of people in prison rose from 44,566 to 65,298, an increase of over 46%.
The average prison population in 1993 had actually gone down from 45,817 in 1992 to 44,566, but by 1996 it was up to 55,281 and by 1997, 61,114. Even if no deterrent effect is assumed, the incapacitation effect of imprisoning on average another 20,000 criminals was substantial. The Halliday report, Making Punishments Work, published by the Home Office in July 2001, estimated that the average offender carried out 140 offences per year (Appendix 6, p. 130). This figure was based on a Home Office self-report survey of offenders admitted to prison in 2000. They admitted to an average of 140 offences in the year before they were caught. The variation was large, and offenders who admitted a drug problem, were committing an average of 257 offences per year. (The survey did not cover all types of offence. It was restricted to wounding/assault, robbery, domestic and non domestic burglary, theft of a vehicle, theft from a vehicle, bicycle theft, pick pocketing, shoplifting, handling stolen goods, criminal damage and supply of drugs.)
Many of the additional prisoners would not personally have been in jail for a full year, but we can make a rough calculation of the incapacitation effect of jailing 20,000 full-year equivalent offenders. If each prisoner carried out the average number of offences identified by the Halliday report, then 2.8 million offences against the public would be prevented by 12 months in jail. This approximate measure of the incapacitation effect is quite apart from any deterrent effect on other potential criminals.
