
Housing supply and household growth, national and local
Daniel Bentley, December 2016
 The new government under Theresa May has highlighted the housing crisis as a priority, with a particular emphasis on building many more homes. A housing white paper is due in the New Year that is promised by the communities secretary, Sajid Javid, to get ‘more of the right homes built in the right places’.[1] Recently-published figures showed housing supply at a post-2008 high, but still well short of most estimates of need.
This short note considers how many new homes are needed to keep up with population projections for the coming years, and how last year’s housebuilding compares with those. It also considers the geographical distribution of those homes. It shows that, while housing output is below the required levels nationally, it is particularly inadequate in those areas that are expected to experience the highest growth in the years ahead. The national figures therefore disguise the scale of the housebuilding challenge, which is not only to get enough homes built, but – as Javid recognises – in the right places.
1. Household growth
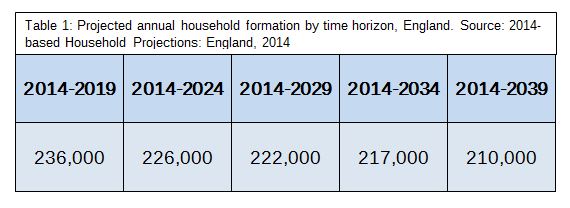
The number of households in England is projected by the government to increase from 22.7 million in 2014 to 28 million in 2039. This is an average for the 25-year period of 210,000 a year. However, a disproportionate amount of this growth is expected to take place earlier in the period. Between 2014 and 2019, household growth is projected to be running at 236,000 a year, for instance.[2] Sajid Javid recently referred to the need to build ‘at least 220,000 homes a year for the next decade just to keep up with population growth’;[3] this, however, would more accurately describe household growth over the next 15 years (between 2014 and 2029), as can be seen in Table 1.
Projected household growth rates are therefore highly dependent on the time horizon considered, but pressures are very much greater in the shorter term than they are expected to be over the longer term. Citing a long-term growth rate makes the challenge of meeting it sound easier to accomplish; it is important to bear in mind, however, that this could very well under-shoot needs in the short term.
A note on the household formation projections: these are based on demographic trends up until 2014, considering rates of population growth and the proportion of households that are likely to be formed out of such a population. They therefore describe the number of households that statisticians at the Department for Communities and Local Government would expect the population to form based on long-term trends and – importantly – assuming there are enough houses for them to move into. This last point is a crucial consideration here, as an under-supply of homes is likely to curtail the number of households that are actually formed in the years ahead. This may take the form of young adults not moving out of their parents’ home when they previously would have done, or people joining house-shares, or people becoming homeless. Even if those households are not actually formed, however, the pressure for housing will remain.
Not only is future household growth likely to be suppressed by an under-supply of new homes, but there is some evidence that under-supply in previous years has already suppressed household formation to a significant extent. This then raises questions about the household projections for future years – if they are modelled on previous years in which household growth has been suppressed then they are likely to underestimate future pressures.
Another point to consider regarding the household projections is that they do not anticipate the impact of future government policy. This may prove significant in the light of the vote to leave the European Union which will appears certain to lead to a change in immigration policy. It is not yet clear what that might mean in terms of future numbers, but a reduction in net immigration would lead to a reduction in expected household formation. Currently, net migration to England accounts for 49 per cent of the projected increase in population.[4]
2. Housing supply – England
The net supply of new homes in 2015/16 – the first year of the 2015 parliament – was 189,650. This was the highest figure since before the 2008 financial crisis, when output plummeted, but it has still not recovered to pre-crisis levels which reached 223,530 in 2007/8.[5]
Moreover, compared with household growth, this is still only 90.3 per cent of the average annual projected household formation (210,000) for the next 25 years. As we have seen, however, the long-term projection is not as high as the short-term, of 236,000 a year between 2014 and 2019. Using the short-term projection as a benchmark, despite the recent rise in housing supply, the country is still only building 80.4 per cent of the homes it needs just to keep on top of need during this parliament.

It should be noted that this net housing supply figure consists not only of new-build completions but also conversions (the sub-division of existing homes, usually) and change of use (commercial property converted to residential), which gives a gross supply figure. The number of demolitions is deducted from this in order to give a net supply figure. Strictly speaking, the number of new homes that were physicially built in England in 2015/16 was only 163,940 – about 35,000 new homes last year came from conversions (4,760) and change of use (30,600). The net supply figure is used here because it gives a more rounded view of how many new homes have entered the housing stock. There might, however, be considerations about how sustainable it will prove to rely on current levels of conversions and change of use from existing premises, which are by their nature finite.
Even so, at about 90 per cent of long-term household growth, the current supply of housing is approaching the level it needs to be at to keep pace with need over the next 25 years, even if it is further behind the current rate of household growth.

3. Housing supply – local
These national figures disguise a local picture that is less encouraging, however. While housing supply is 90 per cent of long-term household growth for England as whole, there are wide variations from area to area. Worse, those areas that are expected to grow most rapidly over the next 25 years are, on the whole, already performing least well against their household formation projections. As can be seen at a glance from Map 1, housing supply is failing to keep up with household growth most in London and the South-East, where affordability pressures are already most acute. Measured in this way, there are also considerable supply issues in the North West and West Midlands, two areas that are the focus of concerted regional growth strategies for the years ahead.
London
The most obvious example of this is London, where the affordability of housing is worst. While house prices in the capital have been driven up by the higher average earnings of its residents and its attractiveness to investors (both domestic and from overseas), it is also clear that housebuilding rates in London are particularly inadequate given its population growth.
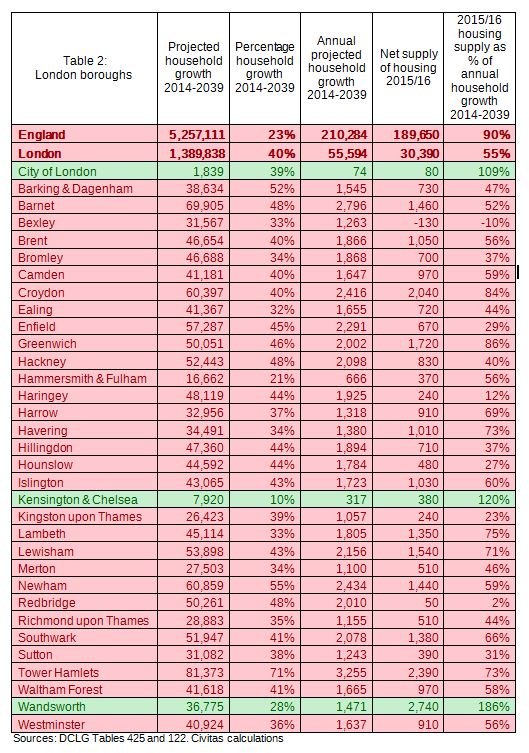
The number of households in London is expected to grow by 40 per cent between 2014 and 2039, faster than anywhere else in England, at an average rate of 55,594 a year. But net housing supply, at 30,390, was just 55 per cent of that last year. This is compared with that national average of 90 per cent. Many of London’s boroughs, particularly the outer ones, compare even less favourably against the national average (Table 2).
Fourteen of London’s 33 boroughs met less than half their household growth in 2015/16. This is a particular issue in the outer boroughs, such as Haringey (12 per cent), Enfield (29 per cent), Sutton (31 per cent), Bromley (37 per cent) and Ealing (44 per cent). A couple were even lower than that. Redbridge’s housing supply was just two per cent of its long-term household growth projection; in previous years it has been higher but not much more than 10-20 per cent since 2008. Bexley even recorded a net loss of housing stock in 2015/16 (because 510 homes were built, but 630 were demolished); in previous years it has not been so low but it has rarely been above about 30 per cent of its long-term household growth projection.
London is regarded as a single housing market and housing targets in the London Plan seek to compensate for the under-supply in the outer boroughs with higher building levels in the inner boroughs. However, only three of London’s boroughs (inner or outer) built more homes than their household growth projections, or indeed more than the national average of 90 per cent, last year. Two of these had notably low household growth numbers to meet: City of London (which supplied 80 homes), and Kensington and Chelsea (which supplied 380). Only Wandsworth can be held up as a success story last year, when it delivered 2,740 new homes against a long-term household growth figure of 1,637.
Rest of England
Beyond London, those areas that are growing most quickly are doing least well at ensuring that housebuilding keeps pace with household formation. We considered housing supply for 2015/16 in the 30 fastest-growing local authority areas, first by percentage of household growth, and then by nominal household growth (2014-2039).
The 30 fastest-growing non-London local authority areas in percentage terms are almost all in the South-East (Table 3). Of those, 21 were below the national average in terms of their housing supply measured against household growth, and only five supplied enough homes to keep up with long-term need. These were Uttlesford, Dartford, Ashford, Aylesbury Vale and Slough. Collectively, London plus these next 30 areas expect to experience 38 per cent of England’s household growth over the next 25 years, yet they contributed just 26 per cent of last year’s housing supply.
The 30 fastest-growing non-London local authority areas in nominal terms are more geographically spread, including many of the major towns and cities in the regions (Table 4). Nineteen of these were below the national average on supply vs growth, and only eight built enough homes to keep up with long-term need. These were Leeds, Cornwall, Liverpool, Wiltshire, County Durham, South Gloucestershire, Aylesbury Vale and Newcastle upon Tyne. Collectively, London plus these next 30 fastest growing areas expect to experience 48 per cent of England’s household growth over the next 25 years, yet they contributed only 36 per cent of last year’s housing supply.
To some extent, under-supply in fast-growing areas is made up by ‘over-supply’ in neighbouring or nearby ones; this is a key element in the ‘duty to cooperate’ in the National Planning Policy Framework, that asks local authorities to work together to manage housing supply across boundaries. Oxford, for example, met only 66 per cent of its household growth in 2015/16, but output in the surrounding districts compensates for this so that, for Oxfordshire as a whole, housing supply was 159 per cent of long-term household growth. Brighton and Hove supplied enough homes to meet only 56 per cent of its long-term growth, while West Sussex partly made up for this by supplying 113 per cent of its growth. Such a dynamic seeks to draw off some of the pressure on urban centres by increasing housing availibility in more rural locations.
Frequently, however, even this is not the case as we have seen already in London. As can be seen in Map 1, there are broad swathes of the South-East where the under-supply of new homes is not balanced out by an ‘over-supply’ in nearby locations. This is also true in other strategically-important parts of the country. In the North-West, Greater Manchester (Bury, Manchester, Oldham, Rochdale, Salford, Stockport, Tameside, Trafford and Wigan) collectively supplied only 68 per cent of long-term household growth. The West Midlands (Birmingham, Coventry, Dudley, Sandwell, Solihull, Walsall and Wolverhampton) collectively supplied 71 per cent. Both Greater Manchester and the West Midlands are themselves surrounded by areas of higher housing supply – which is much less true of London and large parts of the South-East.


Conclusion
As Sajid Javid has acknowledged, keeping up with household growth would only be sufficient ‘just to stand still’.[6] To tackle the existing shortage of homes, and very high house prices relative to earnings, housing supply would need to surpass these numbers by considerable margins. Recent estimates have suggested that England may need in the region of 300,000 homes a year to contain house price inflation.[7] Ensuring that housing supply keeps up with household growth must only therefore be a stepping stone to a higher ambition.
It is clear, however, that even meeting household growth remains a considerable task. On a national level it is running at about 80 per cent of current household formation (2014-2019), although it is closer to the longer-term (2014-2019) projection, at about 90 per cent. But regionally and locally the picture is much less encouraging. The fastest-growing areas are falling the furthest short in their housing supply already.
This is a particular challenge for London and the South-East, where the number of areas that are keeping up with household growth are relatively few. While this is averaged out in the national figures by higher housing supply elsewhere, it is far from clear that ‘over-supply’ often in the further reaches of the country is able to compensate in any meaningful way while London remains such a focus of economic activity.
Notes
[1] Sajid Javid, ‘Building the homes we need’, speech, 24 November 2016: https://www.gov.uk/government/speeches/building-the-homes-we-need
[2] See Kate Baker’s comments to the recent House of Lords Economic Affairs Committee, and its own recommendations, in its report ‘Building more homes’: http://www.publications.parliament.uk/pa/ld201617/ldselect/ldeconaf/20/20.pdf. See also analysis by Oxford Economics for the Redfern Review suggesting that output of 310,000 homes a year would keep prices ‘in check’ but still slowly rising: http://www.redfernreview.org/wp-content/uploads/2016/11/20161114-Redfern-Review-modelling-paper.pdf
[3] ‘2014-based Household Projections: England, 2014-2039’, DCLG, p.9: https://www.gov.uk/government/uploads/system/uploads/attachment_data/file/536702/Household_Projections_-_2014_-_2039.pdf
[4] ‘Housing supply; net additional dwellings, England: 2015-16’, DCLG: https://www.gov.uk/government/uploads/system/uploads/attachment_data/file/568403/Housing_Supply_England_2015-16.pdf
[5] Sajid Javid, ‘Building the homes we need’, speech, 24 November 2016: https://www.gov.uk/government/speeches/building-the-homes-we-need
[6] ‘2014-based Household Projections: England, 2014-2039’, DCLG: https://www.gov.uk/government/uploads/system/uploads/attachment_data/file/536702/Household_Projections_-_2014_-_2039.pdf
[7] Sajid Javid, ‘Building the homes we need’, speech, 24 November 2016: https://www.gov.uk/government/speeches/building-the-homes-we-need
About the Author
Daniel Bentley is Editorial Director at Civitas and a former journalist. His reports include ‘The Future of Private Renting: Shaping a fairer market for tenants and taxpayers’ (2015) and ‘The Housing Question: Overcoming the shortage of homes’ (2016). He can be emailed at daniel.bentley@civitas.org.uk and tweets @danielbentley.
Download PDF